|
|

| Climate Data from the Past to the Present |
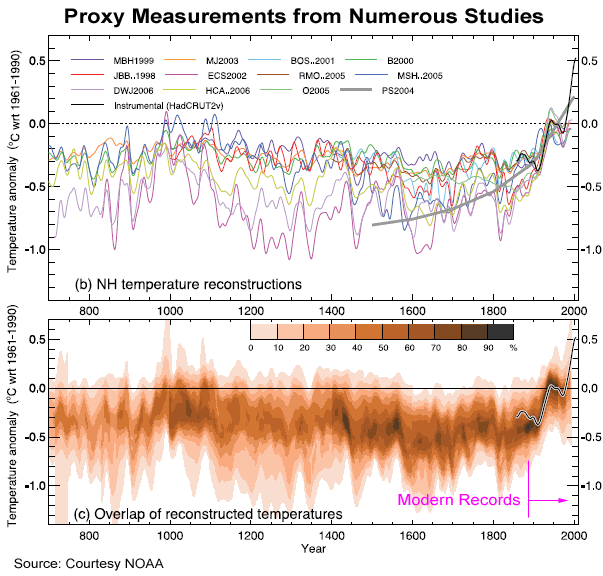
Evidence about the Earth's climate in the distance past comes from assessments of gas trapped in ice core samples, fossils deep in ocean and lake sediments, corals, tree rings, etc. Because such samples provide indicators of past climates they are typically called proxies. Nations and scientists around the world have collaborated on gathering and developing many of them with the intent of gaining a better understanding of the Earth's past climate and where it may be headed. The upper plot above shows a sample of the temperature trends a number of these proxies provide in the North Hemisphere over a slice of the past. Few are complete records though, being more typically widely detached samples that have been aging through many thousands of years of geological activity, with the possibility of numerous abrupt local climate shifts reflected in their makeup due to regional changes in circulations, vegetation, and heat exchanges over time; so it is not surprising that the records show significant scatter as a whole. For these reasons the proxies are far from perfect indicators with it being unlikely that such evidence will ever be fully reconcilable and congruous. None-the-less, when these proxies are merged together mathematically, they do establish a telling story as can be seen by the dark band in the lower plot above.
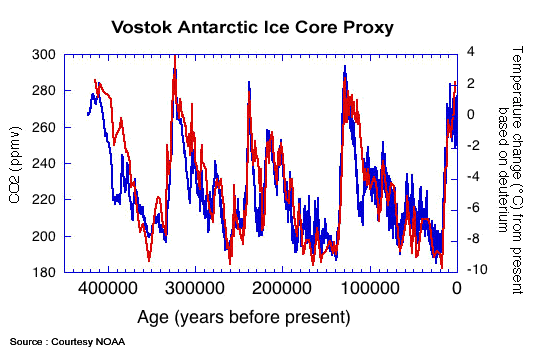
Some of the best evidence for past climates comes from the core samples of ice sheets in Antarctica, Greenland, and other locations. These ice sheets represent the accumulation of many thousands of years of snow and ice through time being laid down year after year. Within each of these layers are encapsulated samples of the Earth's atmosphere that can be used to establish a record of the temperature and greenhouse gases in the atmosphere over time. Above is a plot of the temperature and carbon dioxide proxy obtained from cores of the Antarctic ice sheets at Vostok. The spikes and valleys in this record have been found to match well with the geological record of the coming and going of ice ages.
Notice in the record how the Temperature (blue line) and Carbon Dioxide (red line) fluctuations closely follow one another. Methane Gases concentrations have a similar matching pattern. The casual correlations provide a measure of historical evidence that the concentrations of greenhouse gases influence the Earth's climate. A closer examination of these proxies however, reveal that the Carbon Dioxide and Methane changes lag the expected temperature changes on average by several hundred years (see the PNAS article by James Hansen and Makiko Sato). This lag is often used to dispute that greenhouse gas concentrations drive the climate of the Earth, for if they did it is argued their increases would proceed, not lag the temperature spikes. Although this argument cannot and should not be dismissed outright, considering how much scatter there is in the data, the time spans being addressed, and how ancient these records are, it is difficult to theoretically explain and attach any mechanism of immanent significance to this discrepancy; whereas there are numerous plausible explanations for this discrepancy that fit within the prevailing theories of climate science. A few of them are: that there is a lag in the time that gases became sealed into the ice and the possibility they migrate slightly upwards through the ice with time, that the capture of greenhouse gases in Antarctic ice naturally lagged behind due the influences of ocean uptake and circulations and the rates of continental vegetation change and adaptation, and that acting climate feedback mechanisms could have driven the temperature to increase faster than the greenhouse gases did. One of the least understood trends in these records remains a fully viable explanation of how drops in interglacial CO2 occur.
Given the many uncertainties and variability in the records, and the inability to go back in time to gather more precise data, the debate over this slight but perplexing discrepancy is unlikely to ever be rigorously resolved one way or the other. Consequently, none of these proxies should ever be considered as hard facts, but rather they should be considered together, as a whole, to be a very old story passed down through the ages; one that has grown fuzzy with time, but from which we can still make out momentous trends.
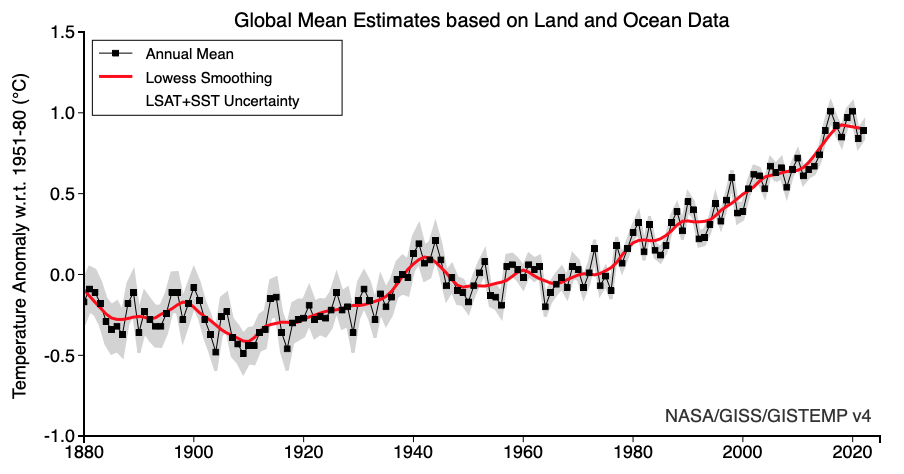
The plot above shows the current warming trends of the Earth based on contemporary instruments of measurement. Clearly it presents a planet that is warming quite quickly. With more than greenhouse gases at play however, especially ocean circulation and sun cycles, no doubt the rise in temperature is, and will contiune to be, irregular in nature as is also apparent in the plot data.
|
| Atmospheric CO2 Timeline |
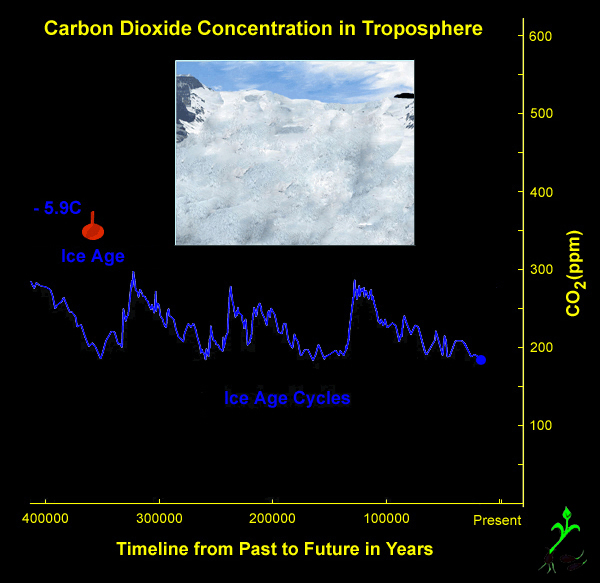 |
The plot above shows an idealized reconstruction of the Earth's Northern Hemisphere carbon dioxide levels and temperature through the ages based on numerous climate proxies and measurements, along with predictions of future greenhouse gas levels and the Earth's temperature based on humankind's projected rate of greenhouse emissions and scientific models of the temperature rise to expect (high end) from the greenhouse gas increases. Often this idealization is given the name "the hockey stick" because of its somewhat linear trend across the ages and pronounced sharp upturn (blade) into the present. While the fine details of the curve are still hotly debated and contested, ever since the late 1970's when climate models began to be used, the recent upturn in the trend over the last 20 to 30 years has been accurately forecasted. Furthermore, there is ever more overwhelming evidence and scientific grounding continuing to be assembled that support the predictions of the Earth rapidly warming. Given these successes and findings, most scientists in the field now agree that the very large spike of greenhouse gases occurring in the last 50 years is unprecedented over many millennium into the past; and that its massive increase foretells of a rapid rise in the Earth's temperature and/or enormously increases the risk of a great climate upheaval. Proxies tend to indicate that we are within 1 or 2 degrees Celsius of the warmest the Earth has been for the last 400 thousand years. Warming much beyond that and we are going into the unknown, with the possibility of the Earth's climate system changing into something quite different than anything modern humans have ever thrived in before.
For a more detailed look at the Carbon Dioxide levels in the atmosphere and how they have changed over time, consider viewing the Bloomberg Carbon Clock which is a presentation based on CO2 measurements from NOAA and the Scripps Institute (Keeling Curve).
|
| Climate Feedback Mechanisms |
The actual temperature increases that may occur in the future due to increases in greenhouse gas concentrations in the atmosphere remains uncertain mainly because the Earth has many significant feedback mechanisms within the dynamics of its climate system. These feedbacks can either amplify or repress the forcing of climate change and are difficult to precisely characterize (this topic is comprehensively covered in our educational software). Likewise, these feedbacks introduce significant non-linearity and unstable chaotic features into the trends. Hence, as would be expected in any serious science studies, there are a number of notable scientists that continue to be skeptical about many of the climate predictions that are being put forth. All the same, credible climate models that accurately track historic climate trends through the orbital cycles of ice ages all appear to have reasonably quantified these strong feedbacks.
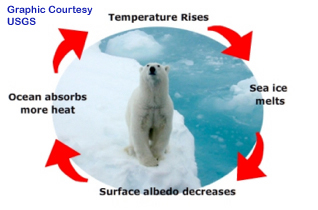
| Polar snow and ice is an example of one of the Earth's climate feedback mechanisms. It is so reflective that as much as 90% of the sunlight striking it reflects back into space. Ocean water on the other hand absorbs nearly 90% of the sunlight energy that strikes it. As the Earth and oceans warm, snow and ice near the Poles melts. This in turn exposes more water that makes the Earth less reflective and more receptive to absorbing energy that can lead to the Earth warming still more; which in turn melts even more snow and ice in ever more cumulative cycles of interaction. Likewise the polar ice and snow feedback can work in reverse to cool the earth ever more as the temperature drops. |
|
| Rise of Sea Level Around the Earth |
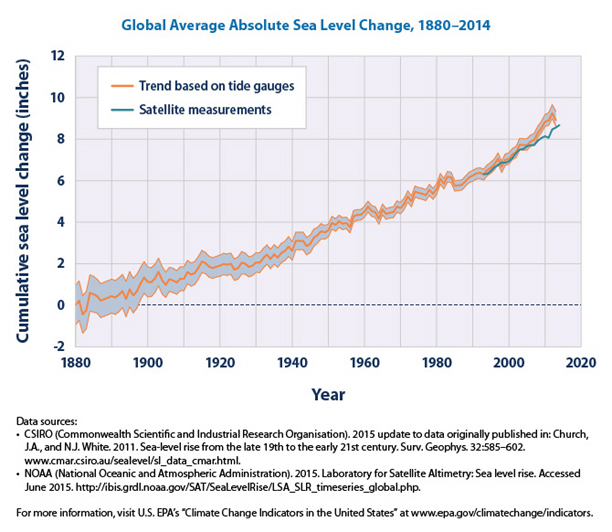
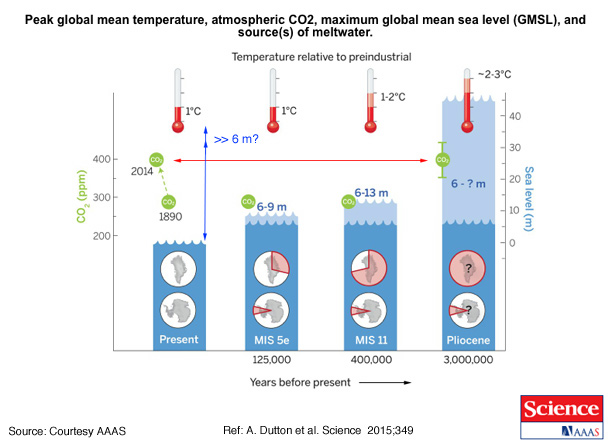
What we do know for certain though is that if the Earth warms, the sea levels around the world will rise due to both thermal expansion of the water and due to landlocked ice sheets and glaciers melting and filling into the seas; and that with this rise, the low-lying coastal regions flood. The image below provides an estimation of the sea level rise that has occured since the industrial revolution started. It documents a trend that appears to show an accelerating rate of rise (also see NASA/NOAA data on sea level rise). While the image that follows provides historic evidence suggesting that even at the present levels of CO2 in the atmosphere the sea levels likely will rise substantially higher into the future. With any additional CO2 put into the atmosphere only forcing the melting to be even faster and more extreme.
|
| Flooding Due to Global Warming |
 Globe of Coastal Elevations above Sea Level
Choose the appropriate link (2mb download): Windows Media or QuickTime or Chromebook
With only modest sea level rises (up to 1m), there is the potential for hundreds of millions of people being displaced with many metropolitan areas being flooded. Moreover, even more extreme is the possibility of a climate "tipping" occurring with warming that causes a massive melting of the ice on Greenland and Antarctica. Such an event (20m or more of rise) would put entire regions of countries underwater within a few centuries. The costs of the resulting regional strife and in rebuilding cities could become enormous. Maps of potential flooding for several regions of the world are provided below.
Regional Maps of Potential Coastal Flooding
Choose the appropriate links for your computer (10mb downloads):
| Windows Media | Quicktime | Chromebook |
|---|---|---|
|
| Other Effects of Climate Change on Humanity |
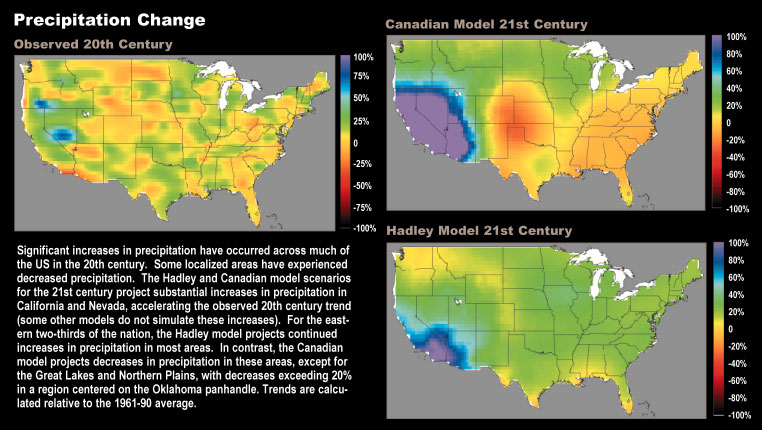
Changes in the climate due to warming are likely to have some positive effects and some negative effects depending on where you live and how much the temperature rises. Climate change impacts: water resources and quality, weather, threats to human health, ecosystems and wild life, coastal and marine resources, agriculture, and the overall quality of life. A number of studies suggest that the negatives will out weigh the positives in most regions if the temperature rises more than 2C to 3C in the next century. Notice in the Atmospheric CO2 Timeline plots (section above) how the storage and availability of fresh water in the mountains diminishes as the temperature rises. There are many resources and web sites that one can access to research how warming may effect where you live and what we can do to mitigate the forcing of climate change and its potential consequences.
For projections of the effects of warming on the United States, consider the 2014 report of the (US) National Climate Assessment: National Assessment of the Consequences of Climate Change
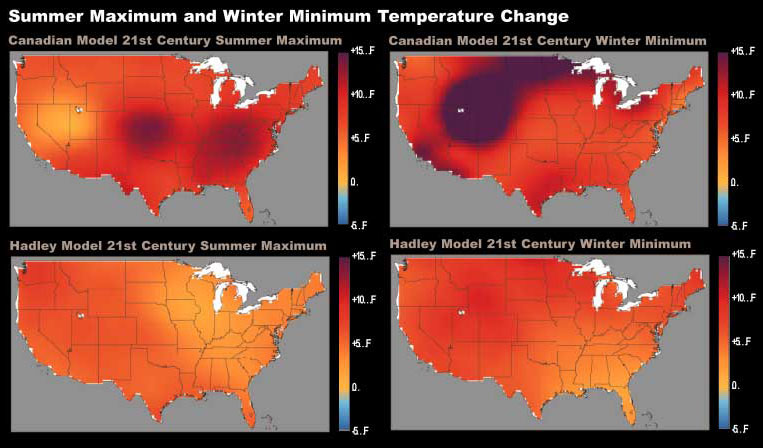
Below are also a few of the projections for the general US continental climate found in the earlier 2000 report of the (US) Global Change Research Information Office (GCRIO):
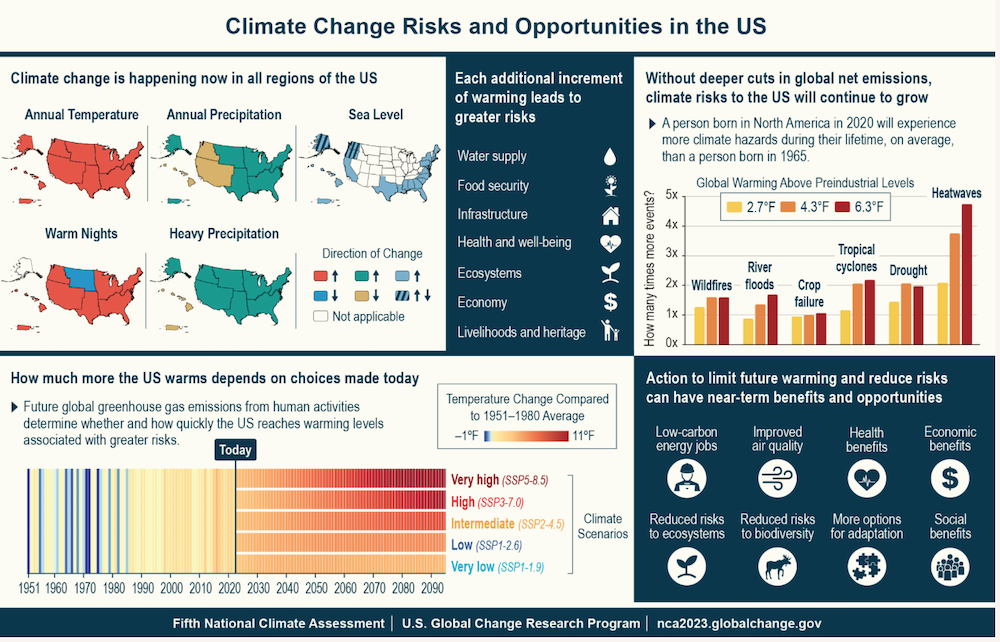
The US Global Change Research Program (USGCRP) delivers a report to Congress and the President nearly every four years. This report is intended to make policy-neutral and policy-relevant information accessible and actionable by relying on the expert judgment of the scientific experts to determine and describe what we know and where uncertainties remain, and to clearly communicate the risks, responses, and opportunities associated with climate change. In the Fifth Assessment of the US Global Change Research Program one can find the latest findings designed to assist the United States and the world in understanding, assessing, predicting, and responding to human-induced and natural processes of global change. Below is an illustration from the assessment highlighting some of the climate change risks and opportunties.
Key Message: Climate Is Changing, and Scientists Understand why...
For projections of the effects of global warming around the world, consider starting with the International Panel on Climate Change (IPCC) Report: Climate Change Impact, Adaptation, and Vulnerability
|
| Treat the Earth well, |


 Home Page
/
Top of Page
Home Page
/
Top of Page
Copyright 2008 to 2023 by Seeds Software - All Rights Reserved World Wide